Analysis — where the money goes
Understand where the money is committed, compare tag budgets, and find the items with the greatest impact.
On this page
The forecast shows when money becomes tight. The analysis screen helps you understand what drives that result: where the money is committed and which items matter most. It uses the same date range as the forecast.
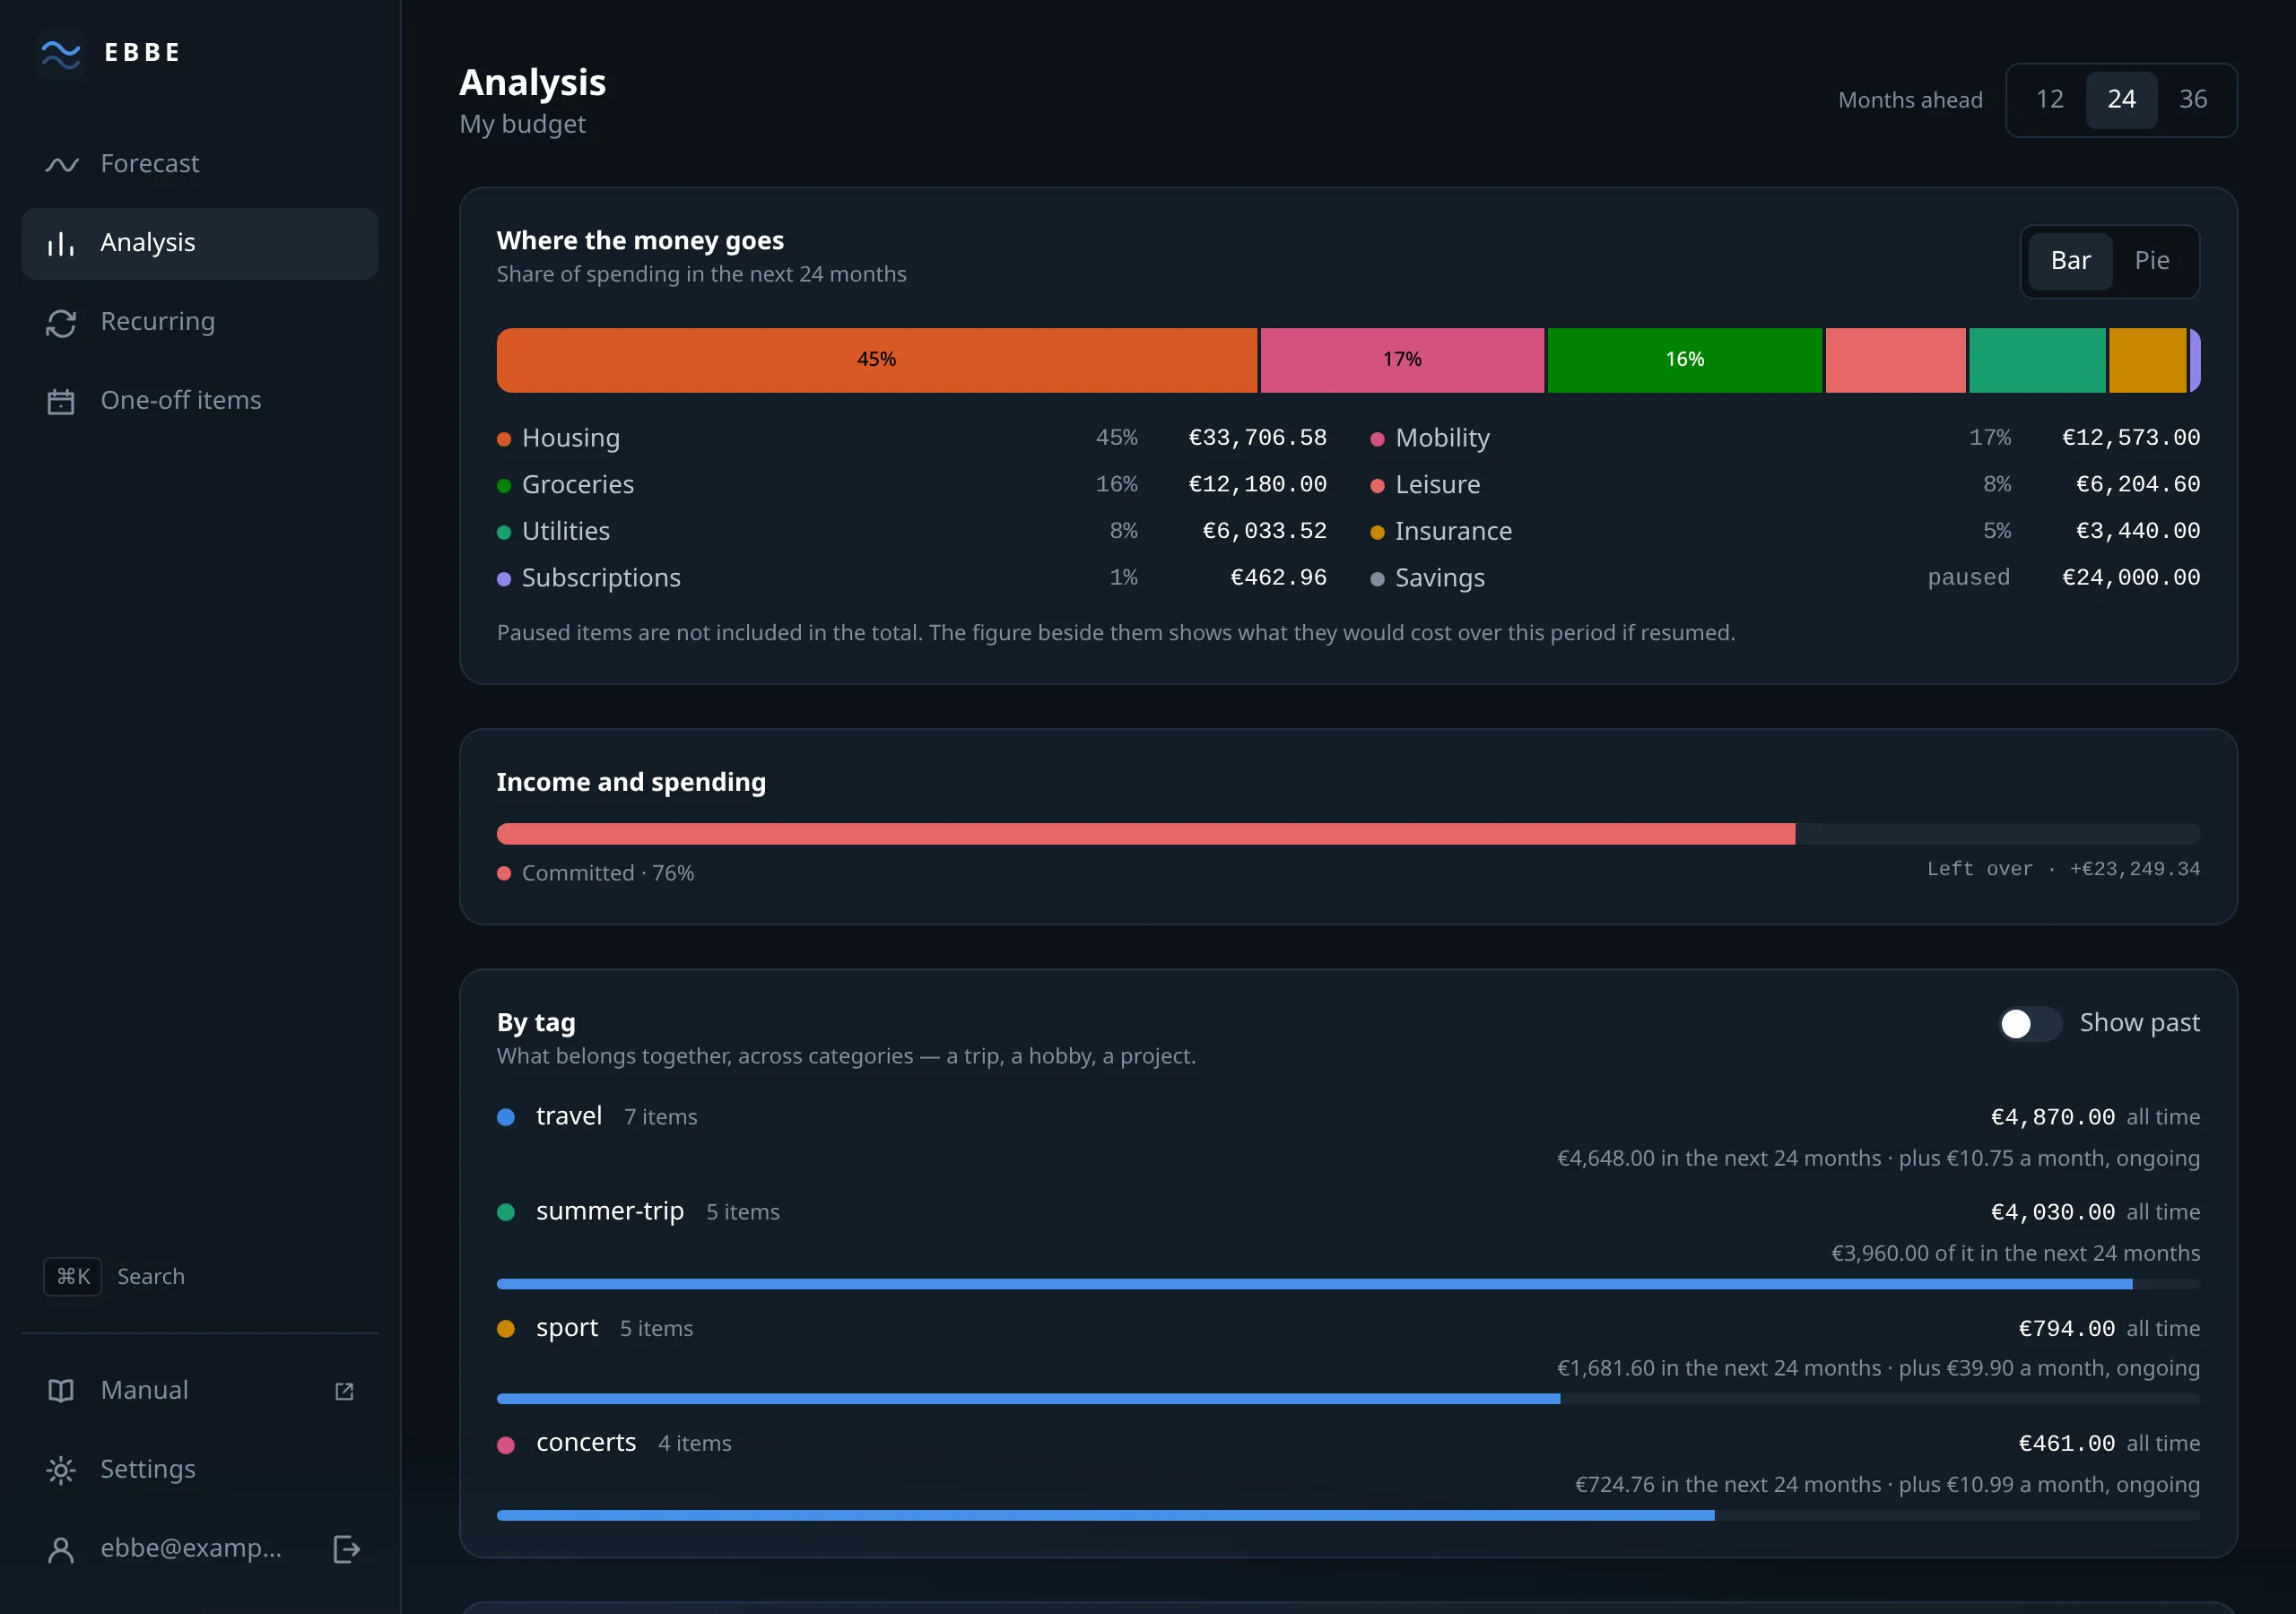
Share of spending
Your spending in the range, divided by category.
Use the toggle to switch between a bar and a ring. The bar makes the categories easy to compare; the ring emphasises how each category contributes to the whole. Your browser remembers the choice.
Either way, a legend beneath lists each category with its exact percentage and exact amount, and each is a link to that category’s page.
Paused items are not included in the total. Categories containing only paused items remain visible in a dimmed style, so you can still find them.
Income against commitments
One bar: what share of your income is already spoken for, and what is left.
This is the fixed-cost ratio. A lower figure leaves more room for flexible spending and unexpected costs; a figure close to 100% means almost all income is already committed, regardless of today’s balance.
It is hidden when there is no income in the range — a ratio against zero says nothing.
By tag
One row per tag: what it has cost, what is still to come, and — if it has a target — how much of it is used.
The bar fills as spending approaches the budget and turns red when it goes past. The tag’s period determines which payments count toward that budget. See tag budget periods for totals and rolling periods.
Finished tags — nothing open-ended, last payment in the past — are hidden behind a Show past switch, so a page about what is coming is not mostly about last winter.
The biggest items
A plain ranking: every item as a bar, longest first, coloured by its category, with its cost per month on the right.
This makes costs with different rhythms comparable. A €40 monthly subscription is €480 a year and may therefore rank above a larger one-off payment.
Paused items are hidden by default, with a switch to show them.
What this screen does not do
The analysis covers the plan ahead, not past transactions, so it does not compare with last year. It also does not recommend cuts or label spending as good or bad. The ranking is based only on size; you decide which commitments matter most to you.
Related
- Categories and tags — what the two groupings mean.
- The category and tag pages — one of these rows, opened up.